This study explores software engineer salaries, tax implications, and savings potential across Europe, helping professionals make informed career and relocation decisions.
This study has been carried out by Andrea Onorato. Connect on LinkedIn or visit my website.
The salaries have been extracted from Glassdoor through web scraping. The data was then processed, normalized to EUR, and cleaned by removing incorrect salary entries based on a specific algorithm.
For the tax analysis, official tax calculators from trusted government websites and other reliable sources were used to compute the gross-to-net salary for a 35-year-old, medium-frugal individual, working the standard weekly hours in their country, unmarried, childless, and without religious obligations.
To estimate the savings rate, cost of living data was sourced from Numbeo.
Move to a Low Cost Of Living (LCOL) country with low taxes, such as Poland or Portugal, and work for a company based in Switzerland or the USA.
Move to either Switzerland or Poland. These countries offer the highest Purchasing Power Index (PPI). Try to secure a job in big tech or finance for the best pay. If top-tier companies are out of reach, consider medium-sized firms in Denmark and the UK.
It depends on your goals. If you plan to settle permanently (e.g., buying a house, starting a family), you should prioritize a high-PPI country. However, if you prefer flexibility, focusing on a high-savings-rate country is a smarter choice.
Countries like Switzerland and the UK offer high salaries but often demand long working hours. In contrast, countries like Denmark and the Netherlands provide a strong balance between salary and work-life harmony.
Yes. Tax rates vary widely across Europe, significantly impacting your net salary and savings. Countries like Switzerland, Ireland, and Poland have relatively lower tax burdens, whereas nations like France or Belgium impose much higher taxes. Relocating strategically based on tax policies can greatly enhance disposable income.
Not always. Countries offering the highest salaries, such as Switzerland, often have stricter immigration laws and fewer job openings for non-residents. In contrast, countries like Germany and the Netherlands have more job opportunities due to their large economies and international hiring policies.
Poland and Portugal. In Poland in the past years salaries have been growing so fast and many global companies outsource here, plus a growing startup ecosystem is booming. Salary increases will continue due to EU investments and nearshoring. Portugal is increasing number of tech hubs (Lisbon, Porto) attractive for digital nomands and startups. Plus nice government tax incentives for expats.
Hover over a country to see more details for the country.
This boxplot shows the distribution of salaries for each country. The spread indicates salary variations and potential outliers.

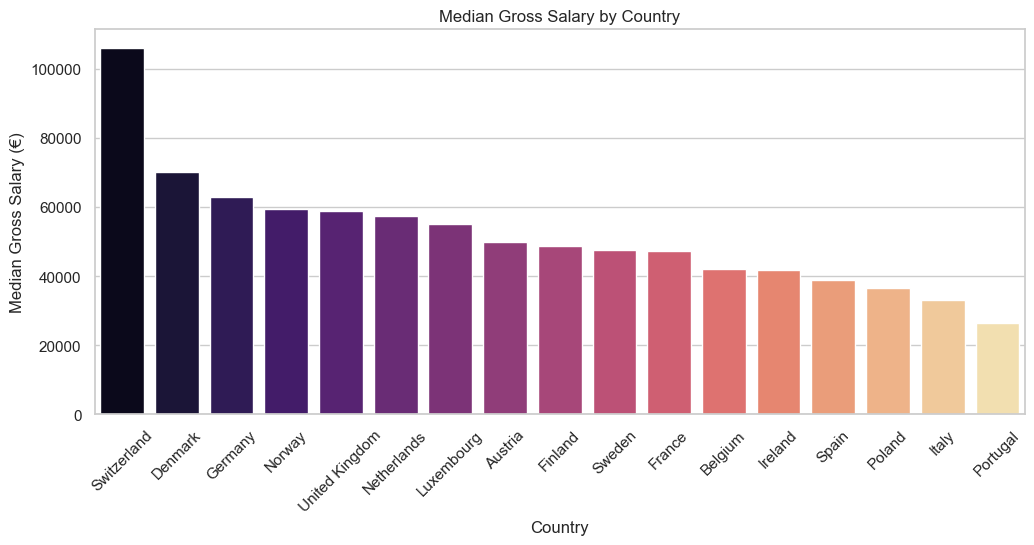
This bar chart presents the median gross salary in each country.
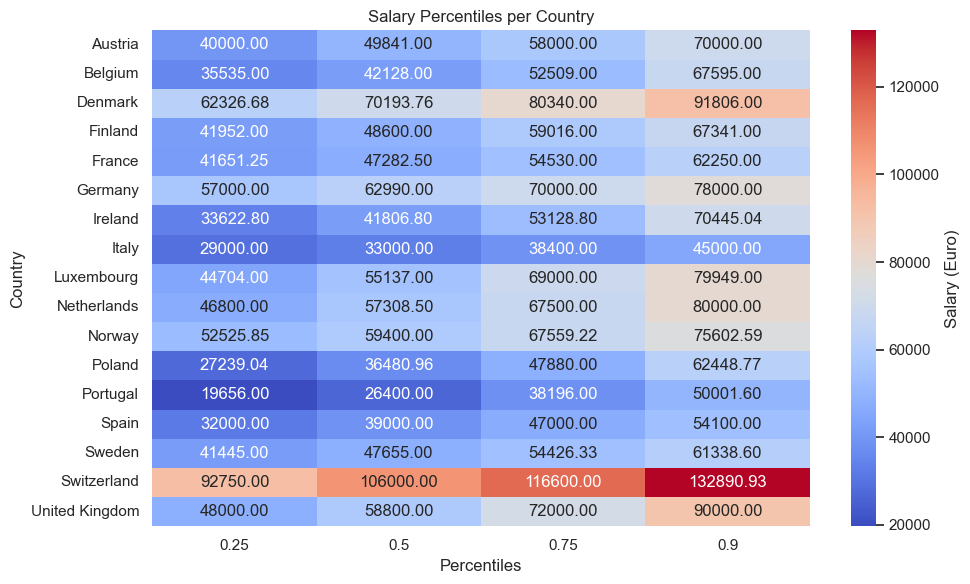
This heatmap provides gross salary percentiles (25th, 50th, 75th, 90th) to understand salary distribution in each country.
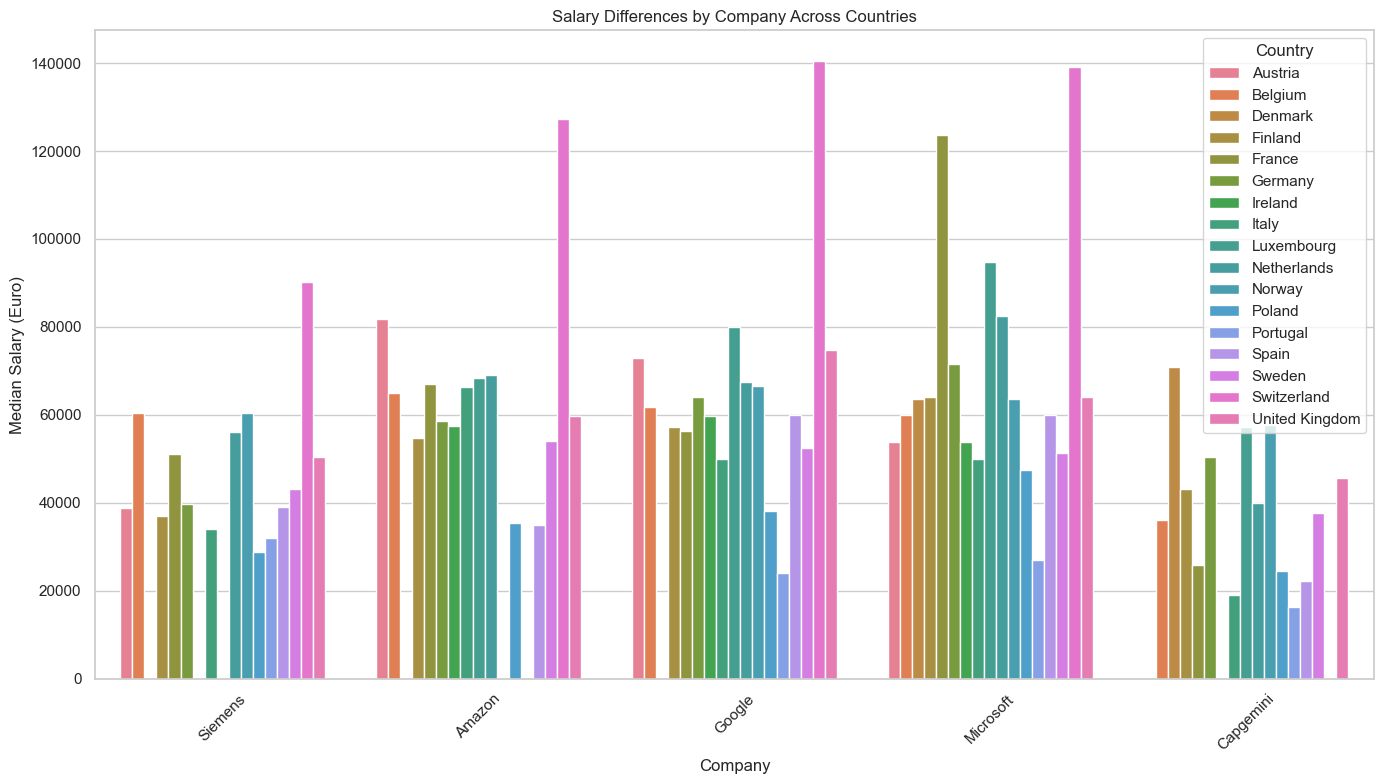
This barchart shows how these 5 companies pays in each different country.
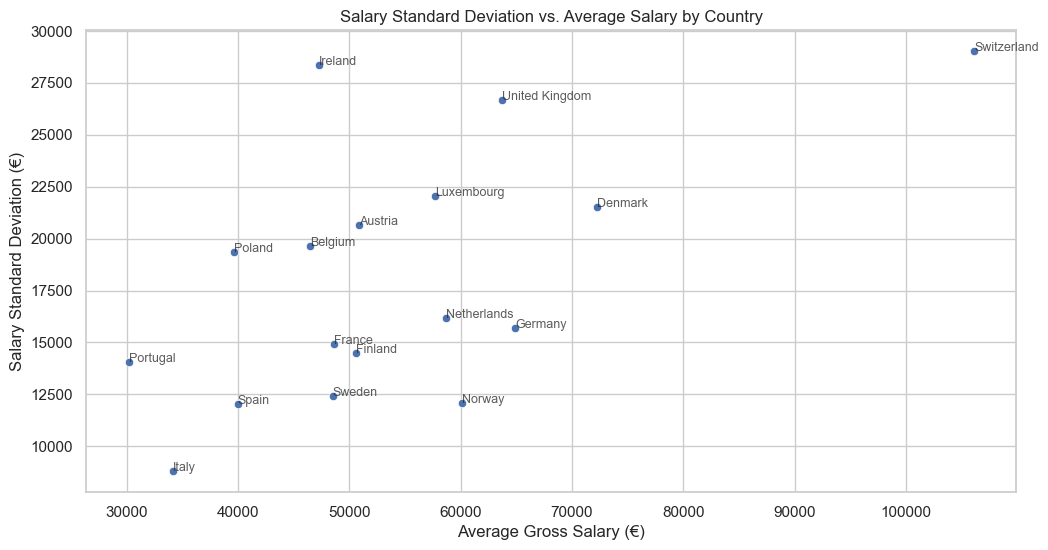
A measure of salary variability within each country. A high standard deviation indicates a greater disparity between the lowest and highest salaries. High standard deviation means that there are many outliers, i.e. many companies that pays a lot more/less than the average. Low standard deviation means that salaries are quite fixed, no much room for super high or super low salaries
In this section I wanted to see also the top 10% salary (90th percentile salary) which rapresent the top 10% companies salary wise for each country which are usually big-tech (FAANG) and trading companies. It will be compared to the median salary.
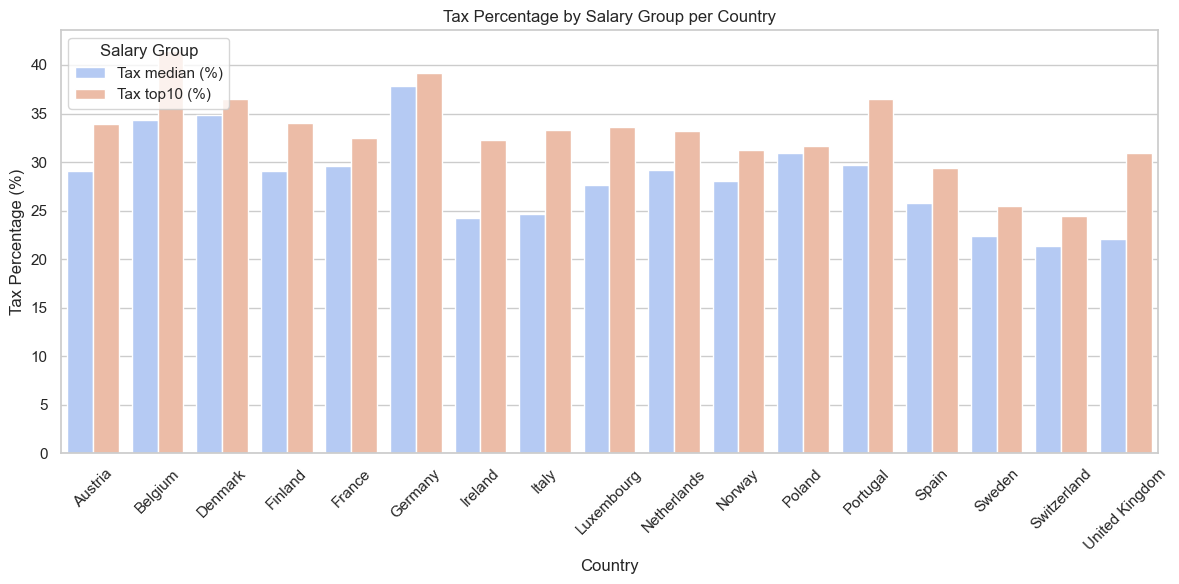
This barchart shows the tax percentage for the median and the top 10% salary (90th percentile salary) across different countries
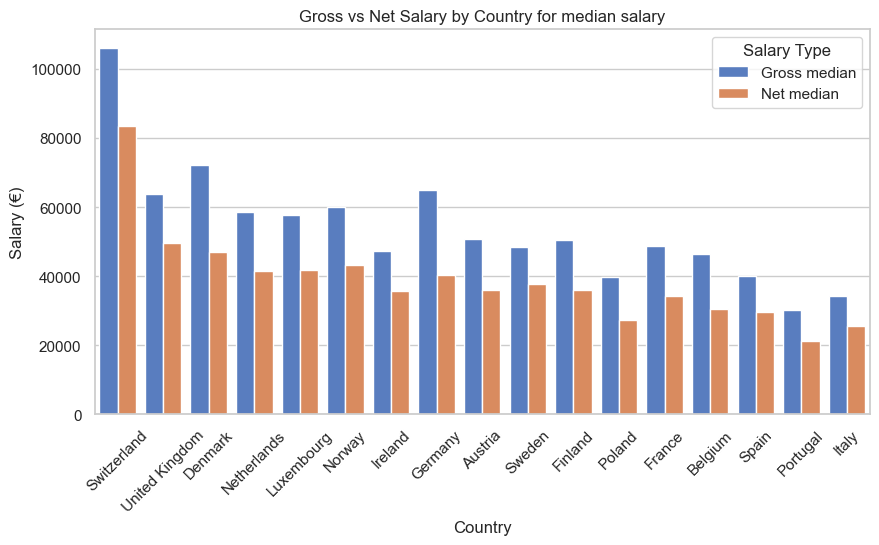
This barchart shows the gross and net salary regarding median salary for each country
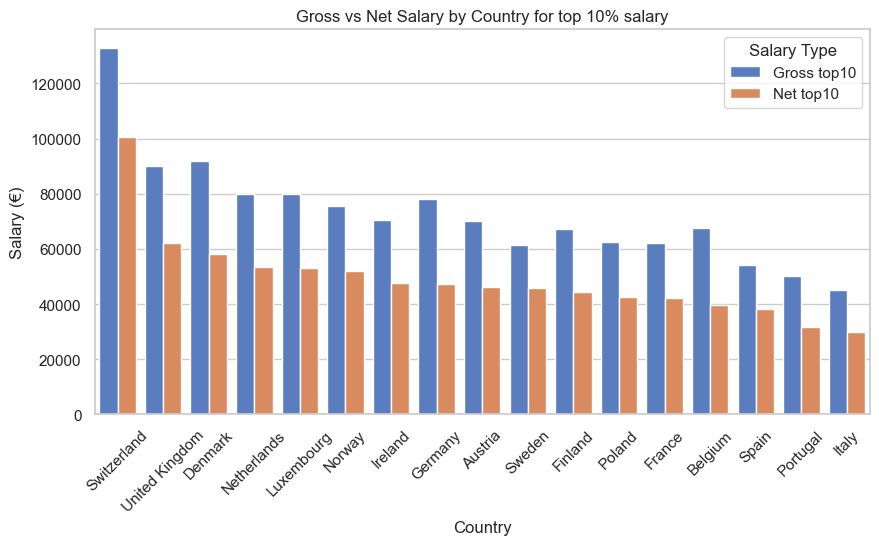
This barchart shows the gross and net salary regarding top 10% salary for each country
This barchart shows the estimated cost of living of each country

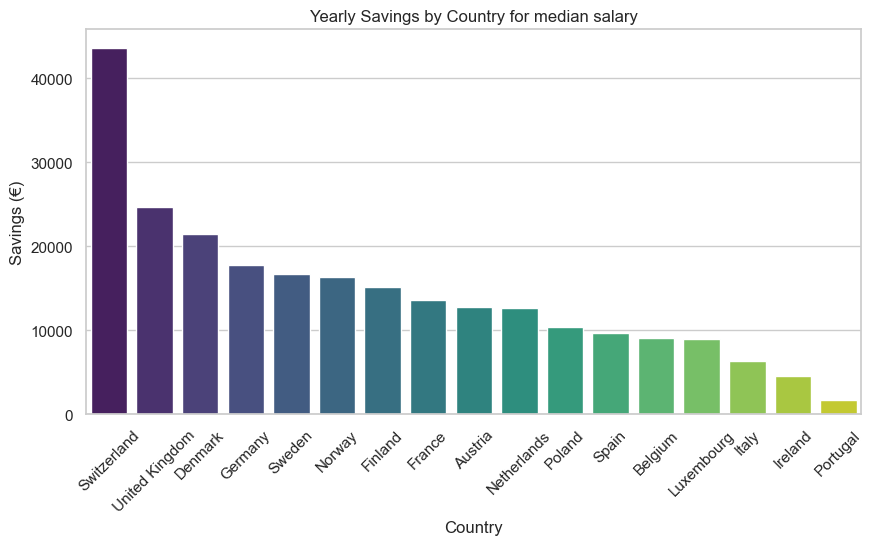
This bar chart illustrates how much median earner software engineers save per year in different countries.
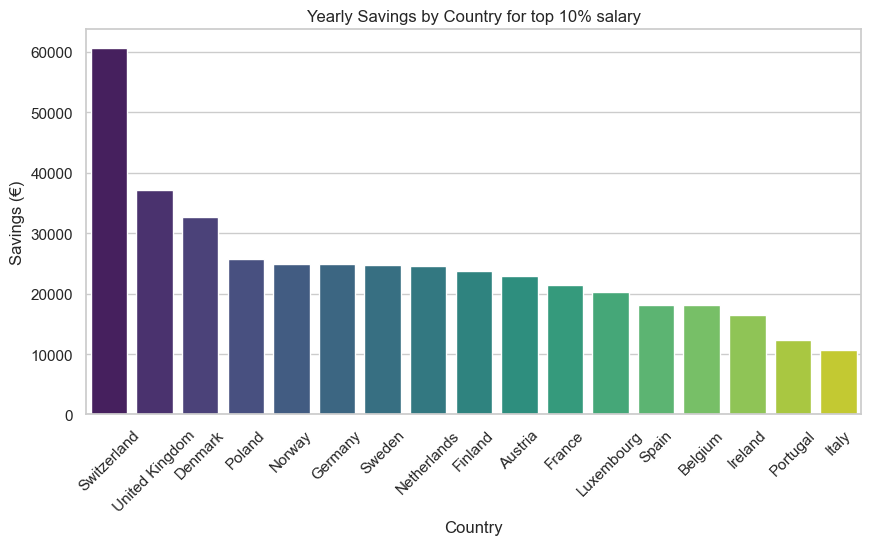
This bar chart illustrates how much top 10% earner software engineers save per year in different countries.
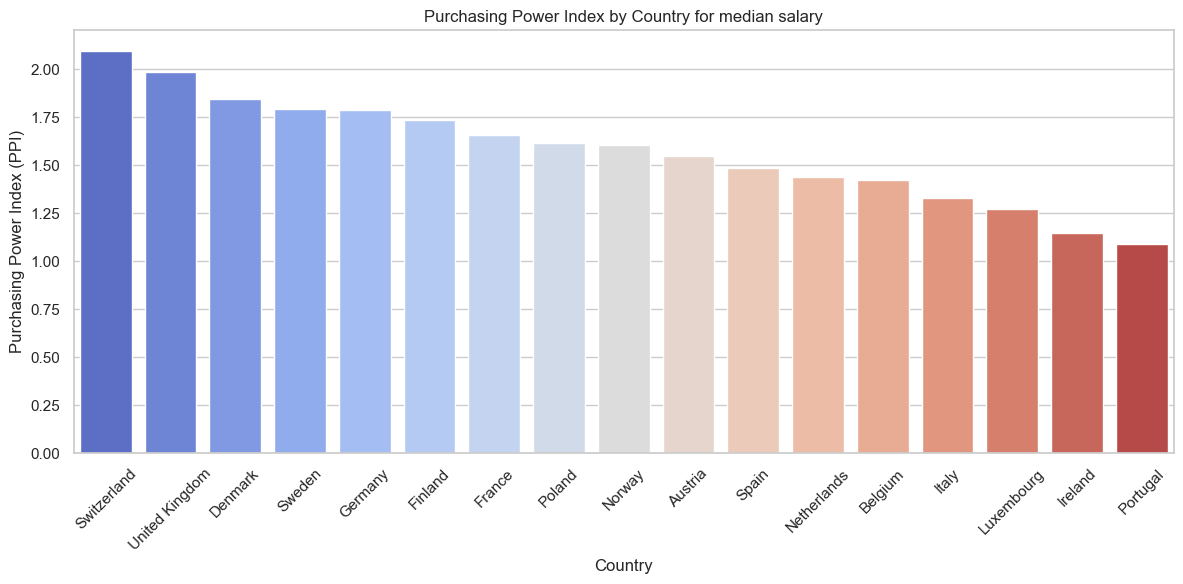
This visualization presents the PPI for median salary for each country.
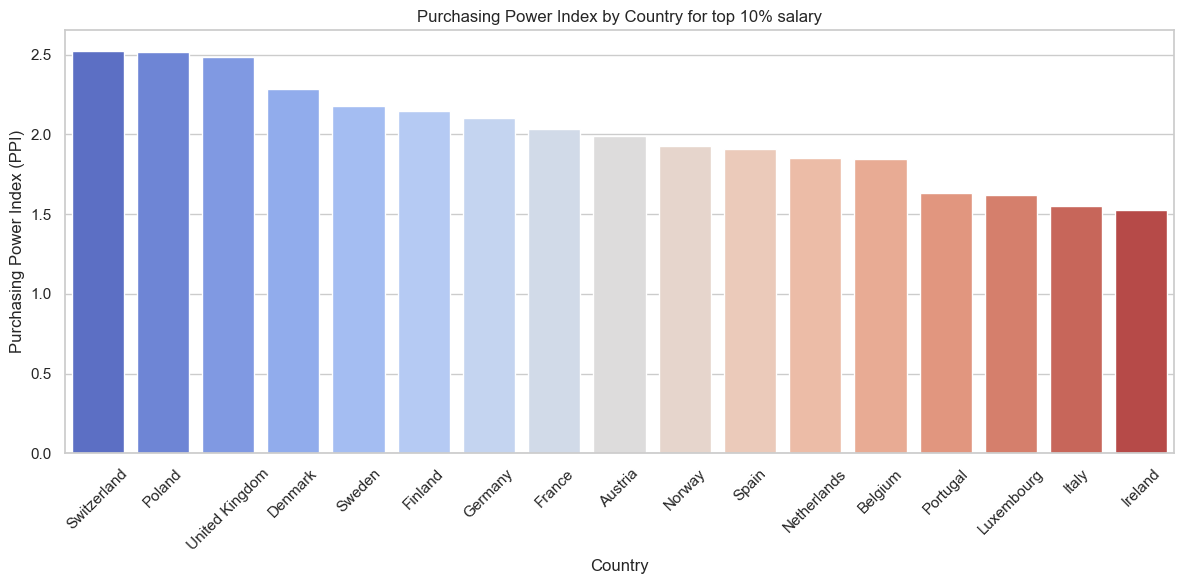
This visualization presents the PPI for top 10% salary for each country.
While Glassdoor provides valuable salary insights, it is not a perfect data source. The dataset includes historical salaries from when Glassdoor was first established, meaning older salaries are still present, potentially skewing results.
Tax calculations are highly complex and depend on numerous personal factors such as marital status, dependents, additional income sources, and deductions. This study assumes a 35-year-old unmarried male, which may not be representative of all individuals.
Cost of living is another variable that can significantly impact savings. Here, a medium-frugal lifestyle was assumed, but individual spending habits vary widely. The results could change substantially if a different lifestyle were considered.
To improve accuracy, acquiring more up-to-date and granular salary data from multiple sources beyond Glassdoor could help refine the analysis.
Further research could incorporate a more dynamic taxation model that adjusts for different personal and financial circumstances, making tax estimates more precise.
It would also be interesting to explore the impact of different lifestyle choices on savings and financial well-being. A sensitivity analysis varying cost of living assumptions could provide deeper insights into how lifestyle affects purchasing power and net savings in different countries.